plotPath provides a visual of a graph and the selected path.
plotPath(graph, ...)

# S4 method for class 'igraph'
plotPath(
  graph,
  by = NULL,
  k = 1,
  include = NULL,
  exclude = NULL,
  res.name = NULL,
  focus = FALSE
)
Arguments
- graph
An igraph object.
- ...
Unused.
- by
A formula specifying the path to plot. (Default:
NULL)- k
Numeric scalar. The kth shortest path to plot. (Default:1)- include
Character vector. Nodes to cross in the path. (Default:NULL)- exclude
Character vector. Nodes to avoid in the path. (Default:NULL)- res.name
Character vector. Names of resources to include in the graph. (Default:NULL)- focus
Logical scalar. Whether the edges and nodes in the path should be plotted. (Default:FALSE)
Value
A ggplot2 object.
Examples
# Retrieve resource graph
graph <- ariadne()
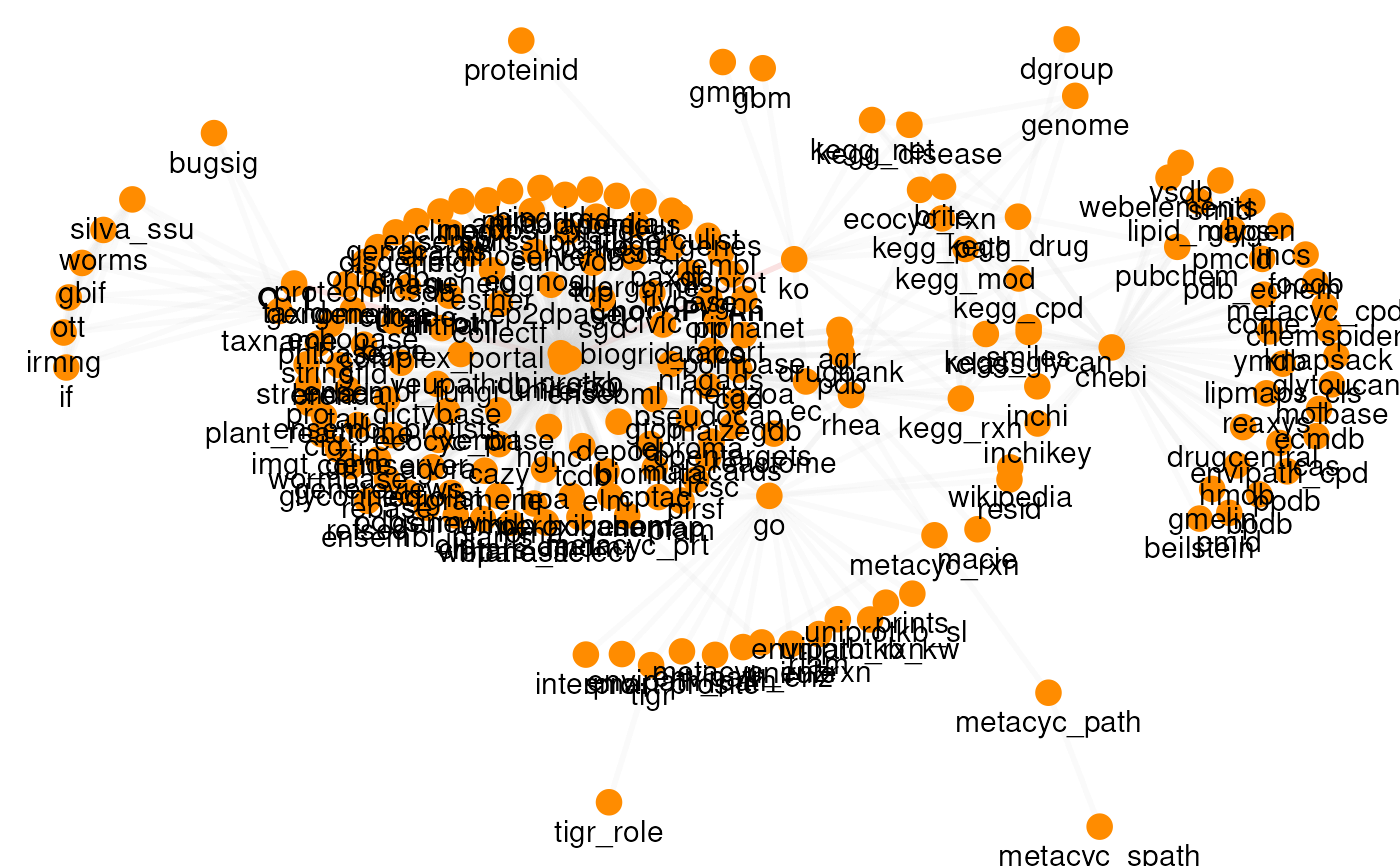
# Plot graph for a subset of resources
plotPath(graph, res.name = c("KEGG", "WoL"))
#> Warning: Using alpha for a discrete variable is not advised.
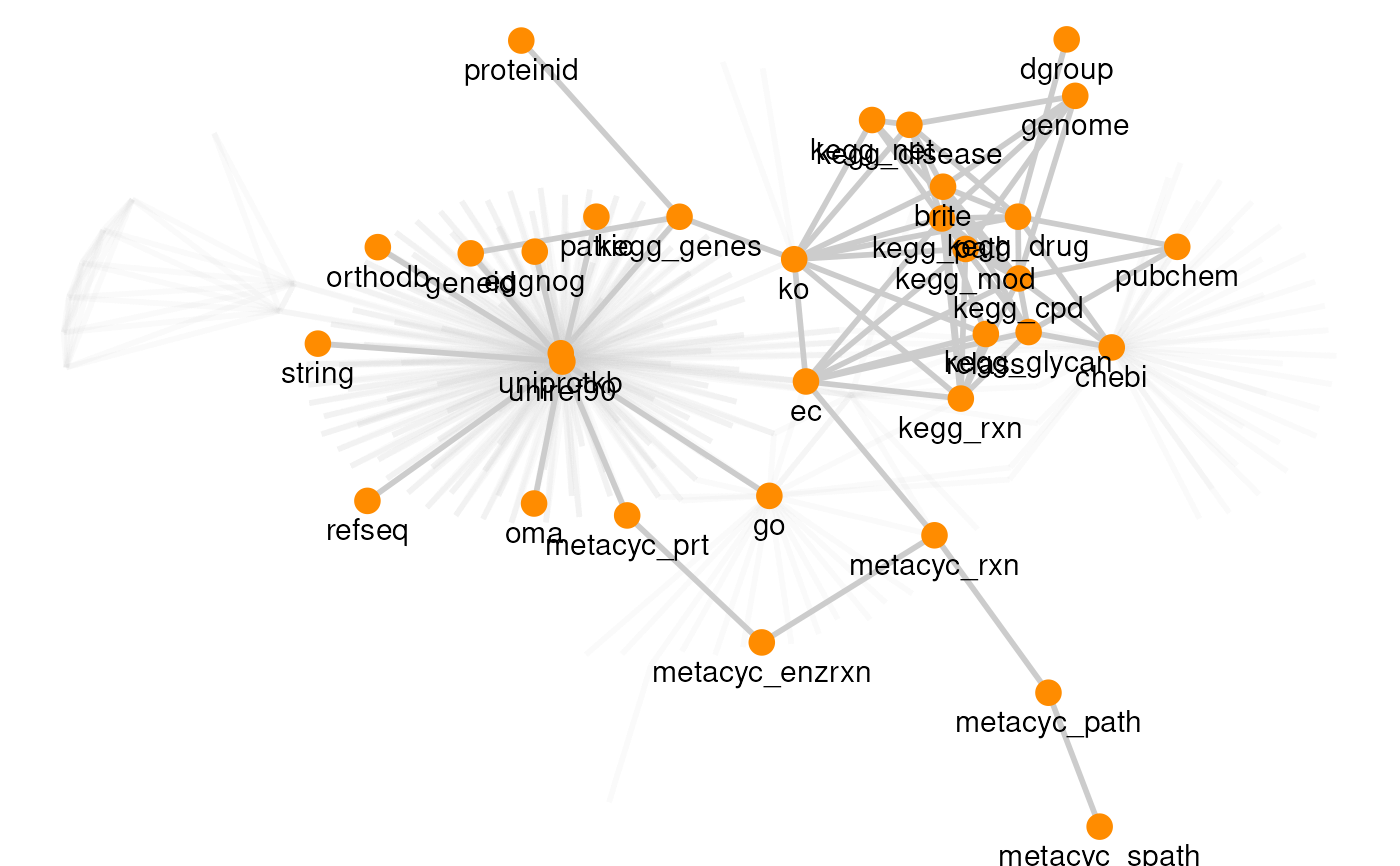 # Plot fifth path from ko to ec
plotPath(graph, ko ~ ec, k = 5)
#> Warning: Using alpha for a discrete variable is not advised.
# Plot fifth path from ko to ec
plotPath(graph, ko ~ ec, k = 5)
#> Warning: Using alpha for a discrete variable is not advised.
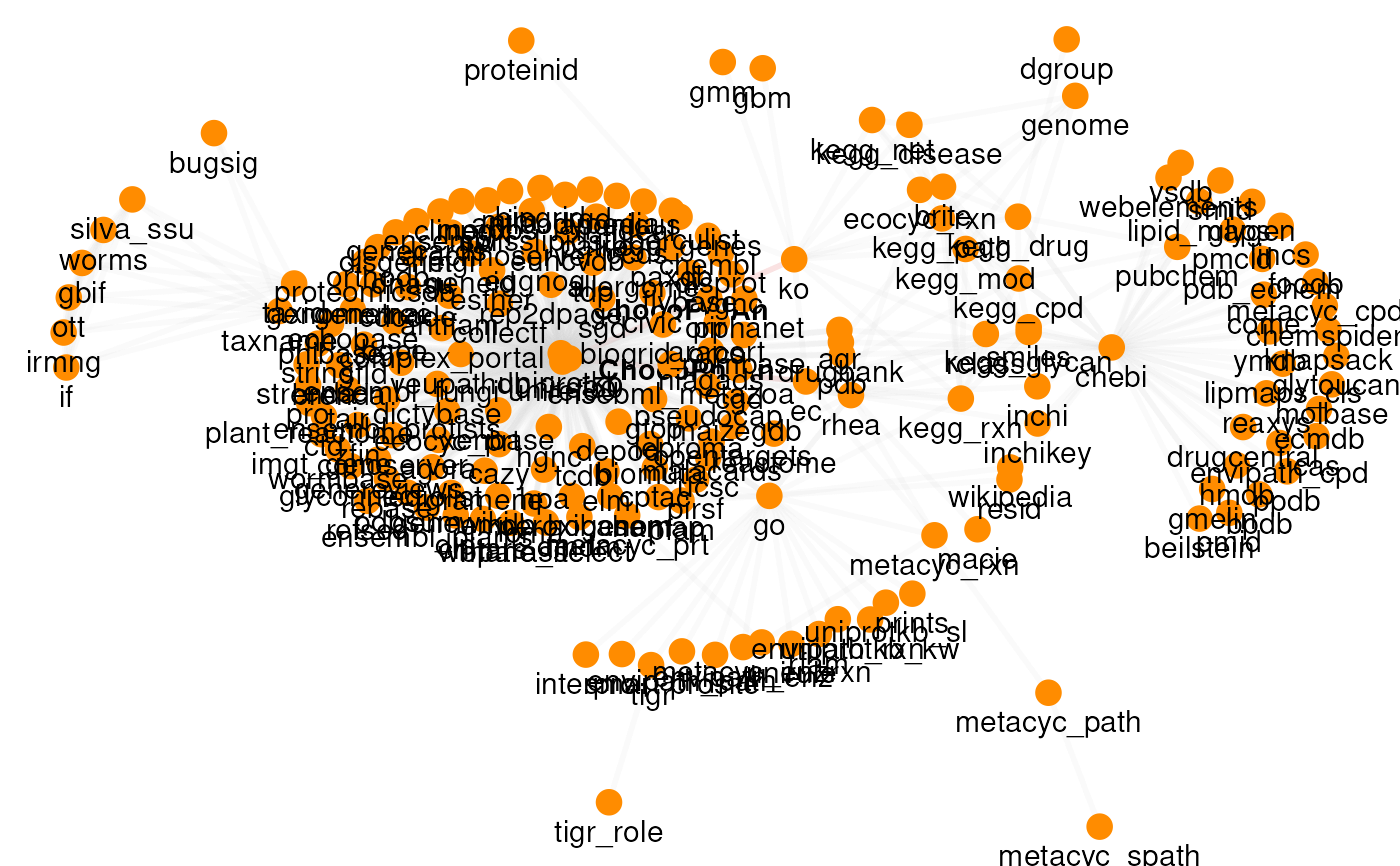 # Plot first path including uniref90
plotPath(graph, taxname ~ ko, include = "uniref90")
#> Warning: Using alpha for a discrete variable is not advised.
# Plot first path including uniref90
plotPath(graph, taxname ~ ko, include = "uniref90")
#> Warning: Using alpha for a discrete variable is not advised.
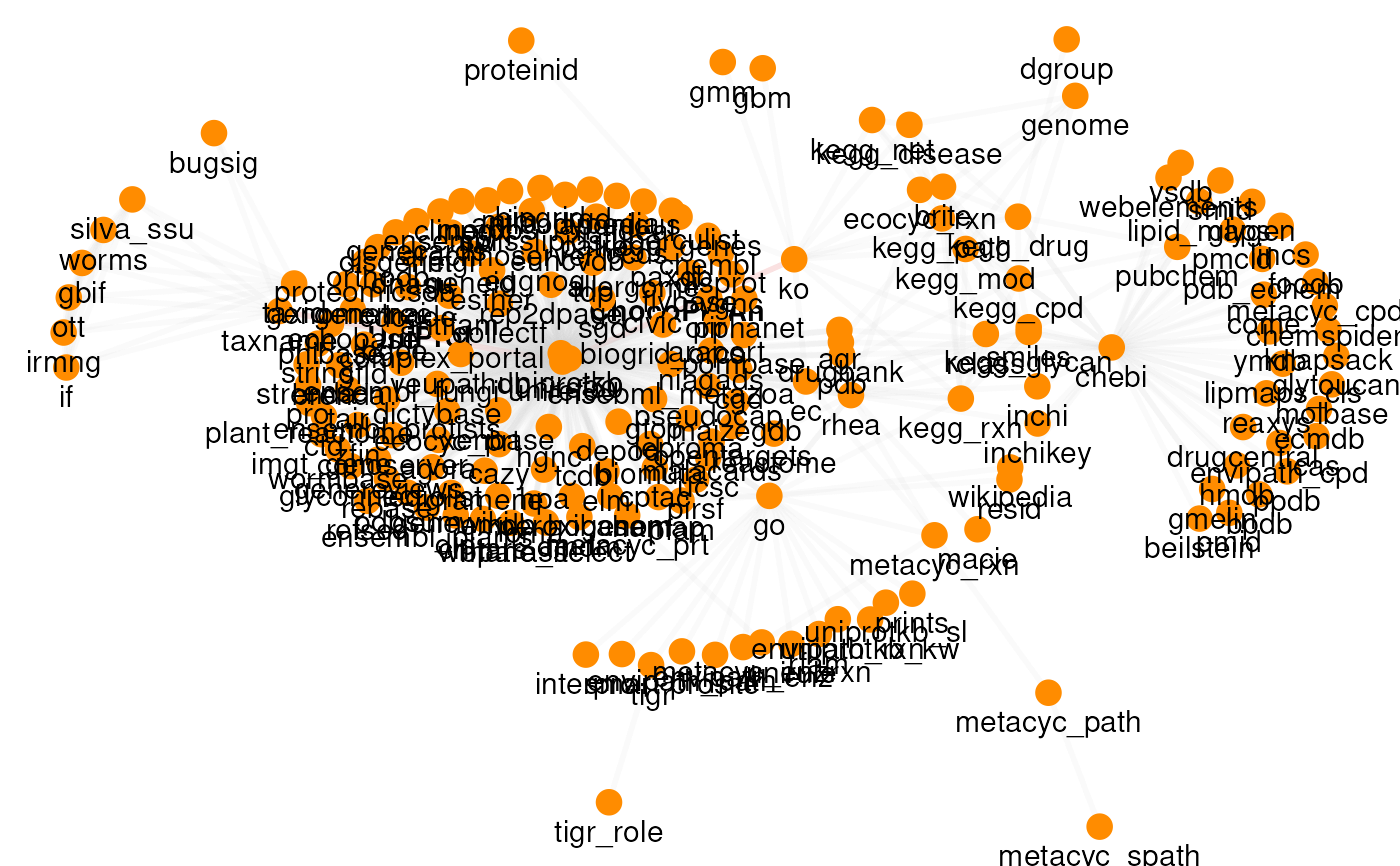 # Plot first 5 paths excluding uniref50 and uniref100
plotPath(graph, taxname ~ ko, k = 5, exclude = "uniref50")
#> Warning: Using alpha for a discrete variable is not advised.
# Plot first 5 paths excluding uniref50 and uniref100
plotPath(graph, taxname ~ ko, k = 5, exclude = "uniref50")
#> Warning: Using alpha for a discrete variable is not advised.