Predicting functional modules: gene families vs taxa
Giulio Benedetti
University of Turkugiulio.benedetti@utu.fi
12 May 2026
Source:vignettes/comparison.Rmd
comparison.RmdPredicting modules from functional profile
# Load gene family experiment
genes <- curatedMetagenomicData(
    "SankaranarayananK_2015.gene_families", dryrun = FALSE
)

genes <- genes[[1]]

# Keep only unstratified gene families
genes <- genes[!grepl("|", rownames(genes), fixed = TRUE), ]

# Print experiment
genes
#> class: SummarizedExperiment
#> dim: 1630528 37
#> metadata(0):
#> assays(1): gene_families
#> rownames(1630528): UNMAPPED UniRef90_A5KNK6 ... UniRef90_A0A1B1NI32
#>   UniRef90_A0A343UZQ1
#> rowData names(0):
#> colnames(37): CA01 CA02 ... CA40 CA41
#> colData names(23): study_name subject_id ... BMI smoker
graph <- ariadne()

searchPath(graph, uniref90 ~ gmm, k = 3)
#> Path 1:
#> uniref90 -(ChocoPhlAn)-> ko -(GM)-> gmm
#>
#> Path 2:
#> uniref90 -(UniProt)-> kegg_genes -(KEGG)-> ko -(GM)-> gmm
#>
#> Path 3:
#> uniref90 -(UniProt)-> ec -(KEGG)-> ko -(GM)-> gmm
# Weave bindings between taxa and GMMs
uniref2gmm <- weaveComplex(graph, uniref90 ~ gmm, init = rownames(genes))
#> uniref90 -(ChocoPhlAn)-> ko
#> ko -(GM)-> gmm

# Print some results
head(uniref2gmm)
#>              uniref90    gmm       cov                       gmm.name
#> 1 UniRef90_A0A068QVT4 MF0090 0.3333333           ethanol production I
#> 2 UniRef90_A0A068QVT4 MF0091 0.5000000          ethanol production II
#> 3 UniRef90_A0A074JIT2 MF0015 1.0000000           fructose degradation
#> 4 UniRef90_A0A075K6L7 MF0067 0.2000000 glycolysis (preparatory phase)
#> 5 UniRef90_A0A075NCB4 MF0005 0.3333333             starch degradation
#> 6 UniRef90_A0A076GS69 MF0097 0.1428571               homoacetogenesis
genes <- addModules(genes, uniref2gmm, as = "names")

uniref.modules <- agglomerateByModule(
    genes, by = "rows", group = levels(uniref2gmm$gmm.name)
)

uniref.modules
#> class: SummarizedExperiment
#> dim: 94 37
#> metadata(0):
#> assays(1): gene_families
#> rownames(94): 4-aminobutyrate degradation acetate to acetyl-CoA ...
#>   valine degradation I xylose degradation
#> rowData names(0):
#> colnames(37): CA01 CA02 ... CA40 CA41
#> colData names(23): study_name subject_id ... BMI smoker
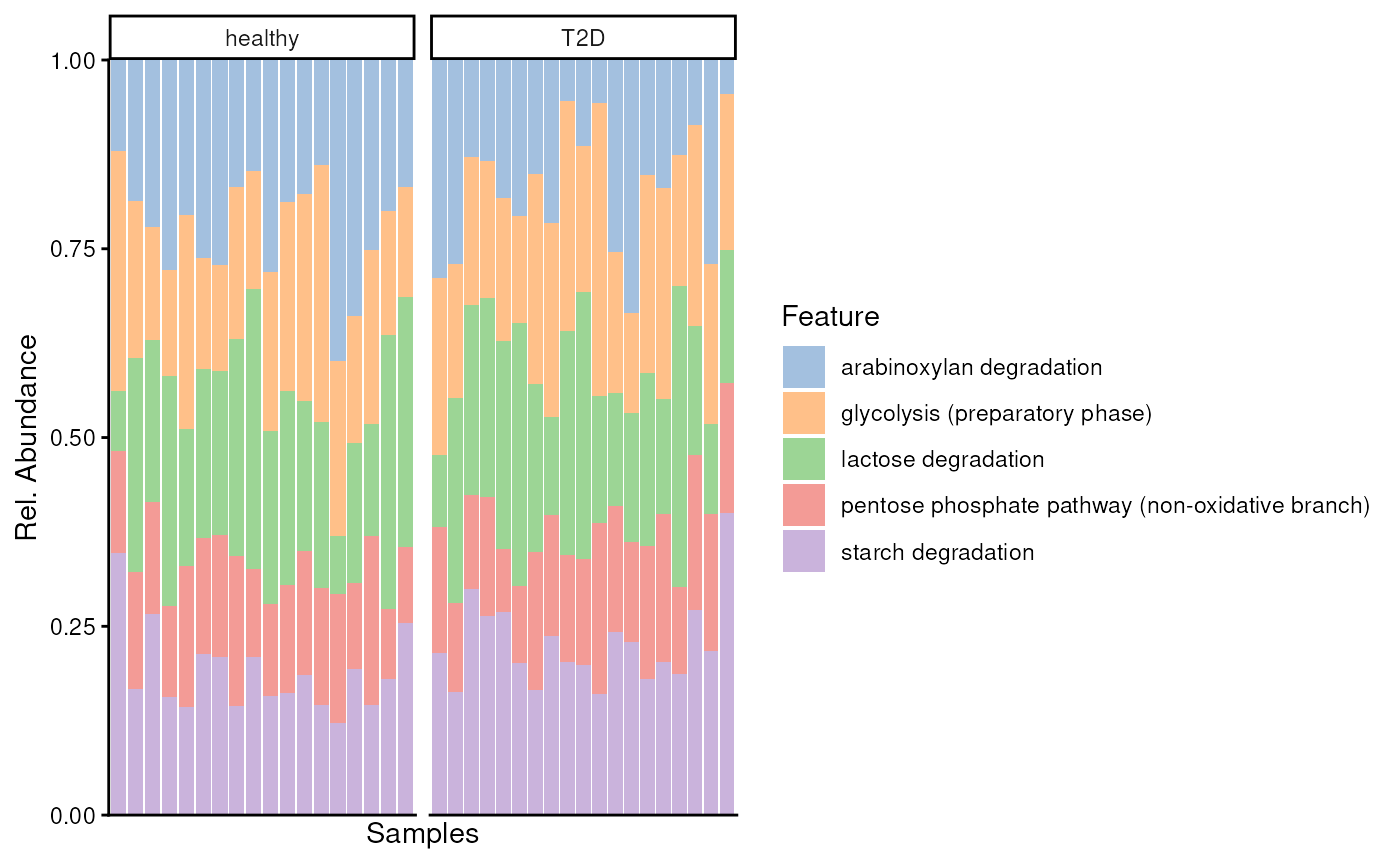
top.mods <- getTop(uniref.modules, assay.type = "gene_families")

plotAbundance(
    uniref.modules[top.mods, ],
    assay.type = "gene_families",
    col.var = "disease",
    scales = "free_x",
    as.relative = TRUE,
    facet.cols = TRUE
)
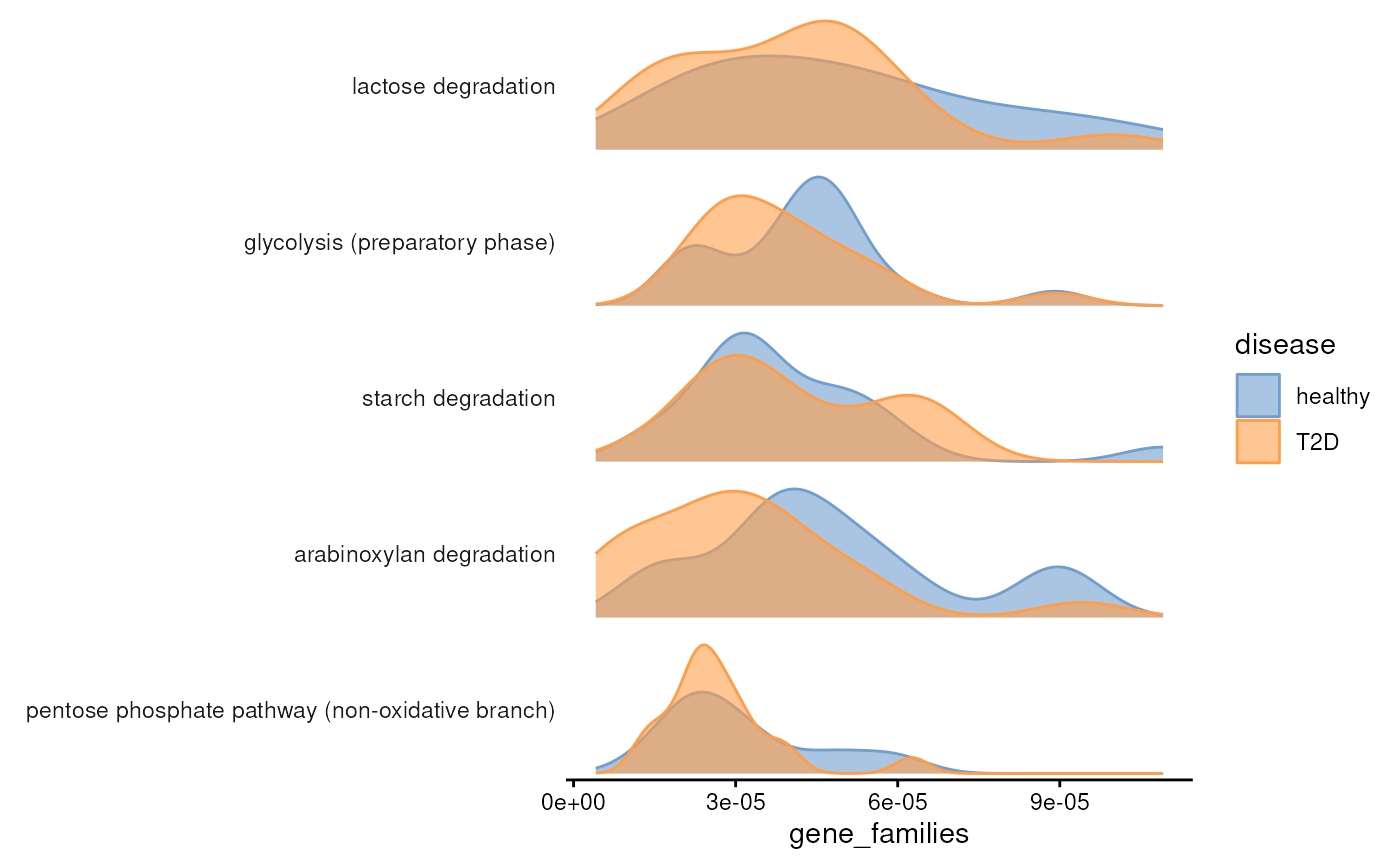
plotAbundanceDensity(
    uniref.modules,
    assay.type = "gene_families",
    n = 5,
    layout = "density",
    colour.by = "disease"
)
Predicting modules from taxonomic profile
tse <- curatedMetagenomicData(
    "SankaranarayananK_2015.relative_abundance",
    rownames = "NCBI",
    dryrun = FALSE
)
#>
#> $`2021-03-31.SankaranarayananK_2015.relative_abundance`
#> dropping rows without rowTree matches:
#>   k__Bacteria|p__Actinobacteria|c__Coriobacteriia|o__Coriobacteriales|f__Coriobacteriaceae|g__Collinsella|s__Collinsella_stercoris
#>   k__Bacteria|p__Actinobacteria|c__Coriobacteriia|o__Coriobacteriales|f__Coriobacteriaceae|g__Enorma|s__[Collinsella]_massiliensis
#>   k__Bacteria|p__Firmicutes|c__Bacilli|o__Lactobacillales|f__Carnobacteriaceae|g__Granulicatella|s__Granulicatella_elegans
#>   k__Bacteria|p__Proteobacteria|c__Betaproteobacteria|o__Burkholderiales|f__Sutterellaceae|g__Sutterella|s__Sutterella_parvirubra
#> Duplicated labels were made unique.

tse <- tse[[1]]

tse
#> class: TreeSummarizedExperiment
#> dim: 365 37
#> metadata(0):
#> assays(1): relative_abundance
#> rownames(365): species:33039 species:33038 ... species:29388
#>   species:76775
#> rowData names(7): superkingdom phylum ... genus species
#> colnames(37): CA01 CA02 ... CA40 CA41
#> colData names(23): study_name subject_id ... BMI smoker
#> reducedDimNames(0):
#> mainExpName: NULL
#> altExpNames(0):
#> rowLinks: a LinkDataFrame (365 rows)
#> rowTree: 1 phylo tree(s) (10430 leaves)
#> colLinks: NULL
#> colTree: NULL
searchPath(graph, taxid ~ gmm, k = 3)
#> Path 1:
#> taxid -(UniProt)-> uniref50 -(ChocoPhlAn)-> ko -(GM)-> gmm
#>
#> Path 2:
#> taxid -(UniProt)-> uniref90 -(ChocoPhlAn)-> ko -(GM)-> gmm
#>
#> Path 3:
#> taxid -(UniProt)-> uniref50 -(ChocoPhlAn)-> uniref90 -(ChocoPhlAn)-> ko -(GM)-> gmm
# Link taxa to gut metabolic modules (remove taxid 562 to speed up)
tax2gmm <- weaveComplex(graph, taxid ~ gmm, k = 2, init = rowData(tse)$species)
#> taxid -(UniProt)-> uniref90
#> uniref90 -(ChocoPhlAn)-> ko
#> ko -(GM)-> gmm

head(tax2gmm)
#>    taxid    gmm       cov                       gmm.name
#> 1 105841 MF0036 0.1666667         isoleucine degradation
#> 2 105841 MF0041 0.1428571           valine degradation I
#> 3 105841 MF0057 0.1666667           lysine degradation I
#> 4 105841 MF0067 0.2000000 glycolysis (preparatory phase)
#> 5 105841 MF0088 0.3333333          butyrate production I
#> 6 105841 MF0089 0.5000000         butyrate production II
tse <- addModules(tse, tax2gmm, key = "species", as = "names")

tax.modules <- agglomerateByModule(
    tse, by = "rows", group = levels(tax2gmm$gmm.name)
)

tax.modules
#> class: TreeSummarizedExperiment
#> dim: 99 37
#> metadata(0):
#> assays(1): relative_abundance
#> rownames(99): 4-aminobutyrate degradation acetate to acetyl-CoA ...
#>   valine degradation I xylose degradation
#> rowData names(0):
#> colnames(37): CA01 CA02 ... CA40 CA41
#> colData names(23): study_name subject_id ... BMI smoker
#> reducedDimNames(0):
#> mainExpName: NULL
#> altExpNames(0):
#> rowLinks: NULL
#> rowTree: NULL
#> colLinks: NULL
#> colTree: NULL
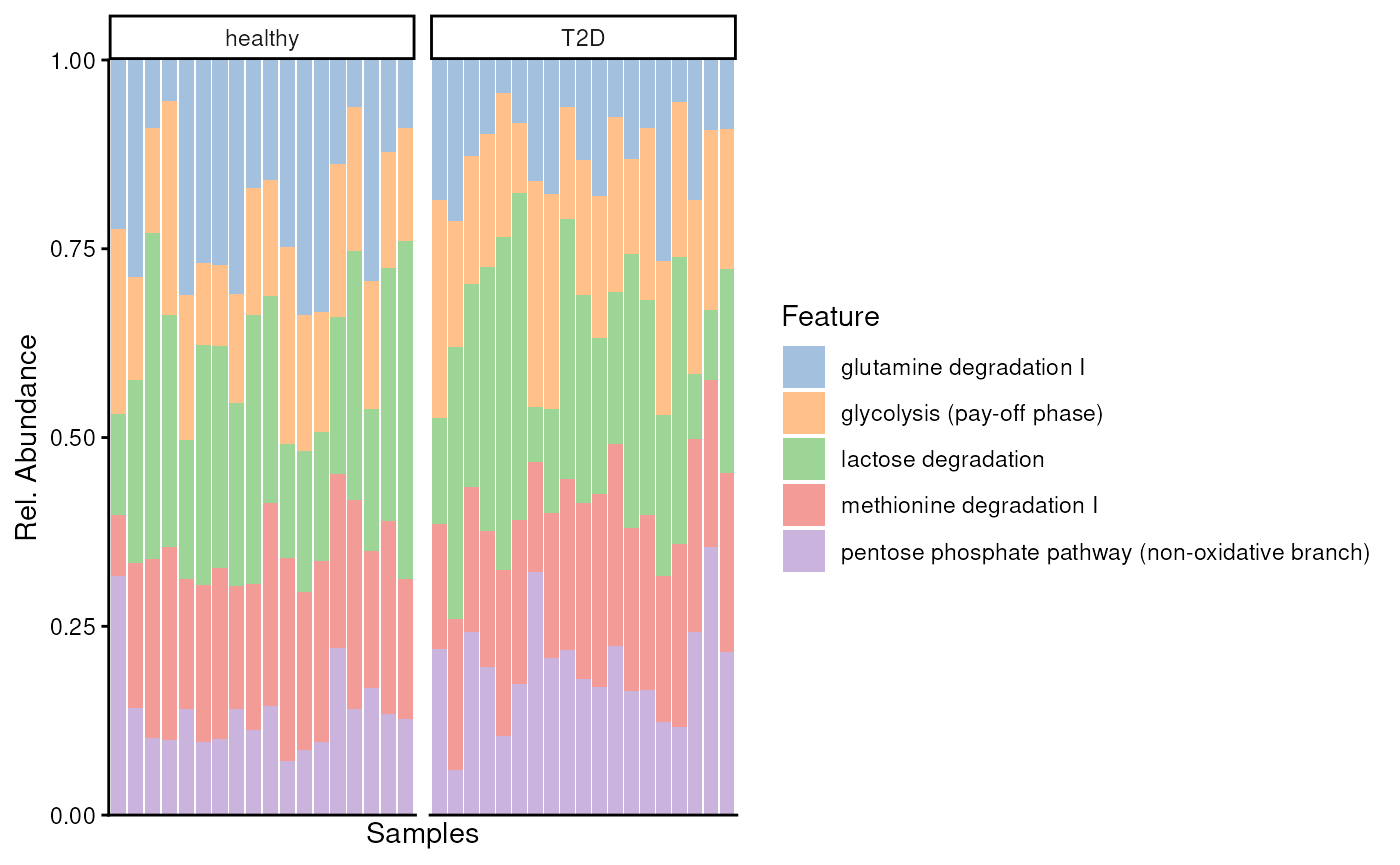
top.mods <- getTop(tax.modules, assay.type = "relative_abundance")

plotAbundance(
    tax.modules[top.mods, ],
    assay.type = "relative_abundance",
    col.var = "disease",
    scales = "free_x",
    as.relative = TRUE,
    facet.cols = TRUE
)
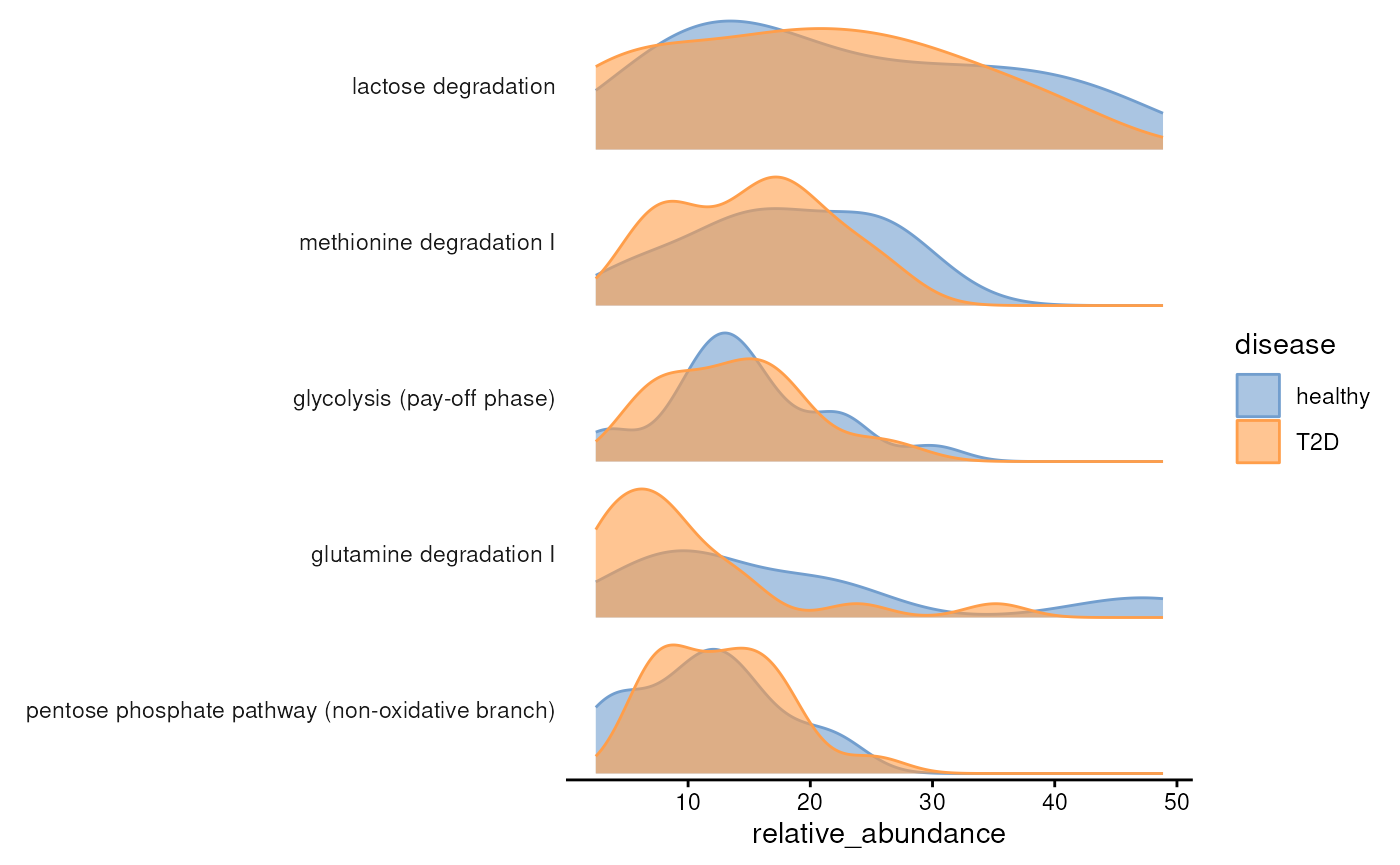
plotAbundanceDensity(
    tax.modules,
    assay.type = "relative_abundance",
    n = 5,
    layout = "density",
    colour.by = "disease"
)
Correlating results
mae <- MultiAssayExperiment(
    experiments = ExperimentList(uniref = uniref.modules, tax = tax.modules)
)
cor <- getCrossAssociation(
    mae,
    assay.type1 = "gene_families",
    assay.type2 = "relative_abundance",
    sort = TRUE
)
#> Calculating correlations...
#> altexp1: -, altexp2: -, assay.type1: gene_families, col.var1: -, dimred1: -, assay.type2: relative_abundance, col.var2: -, dimred2: -
#> by: 1, function: stats::cor, method: kendall, test.signif: FALSE, p.adj.method: -, paired: FALSE, show.warnings: TRUE
#> Sorting results...

cor$Var1 <- as.character(cor$Var1)
cor$Var2 <- as.character(cor$Var2)

cor <- cor[cor$Var1 == cor$Var2, ]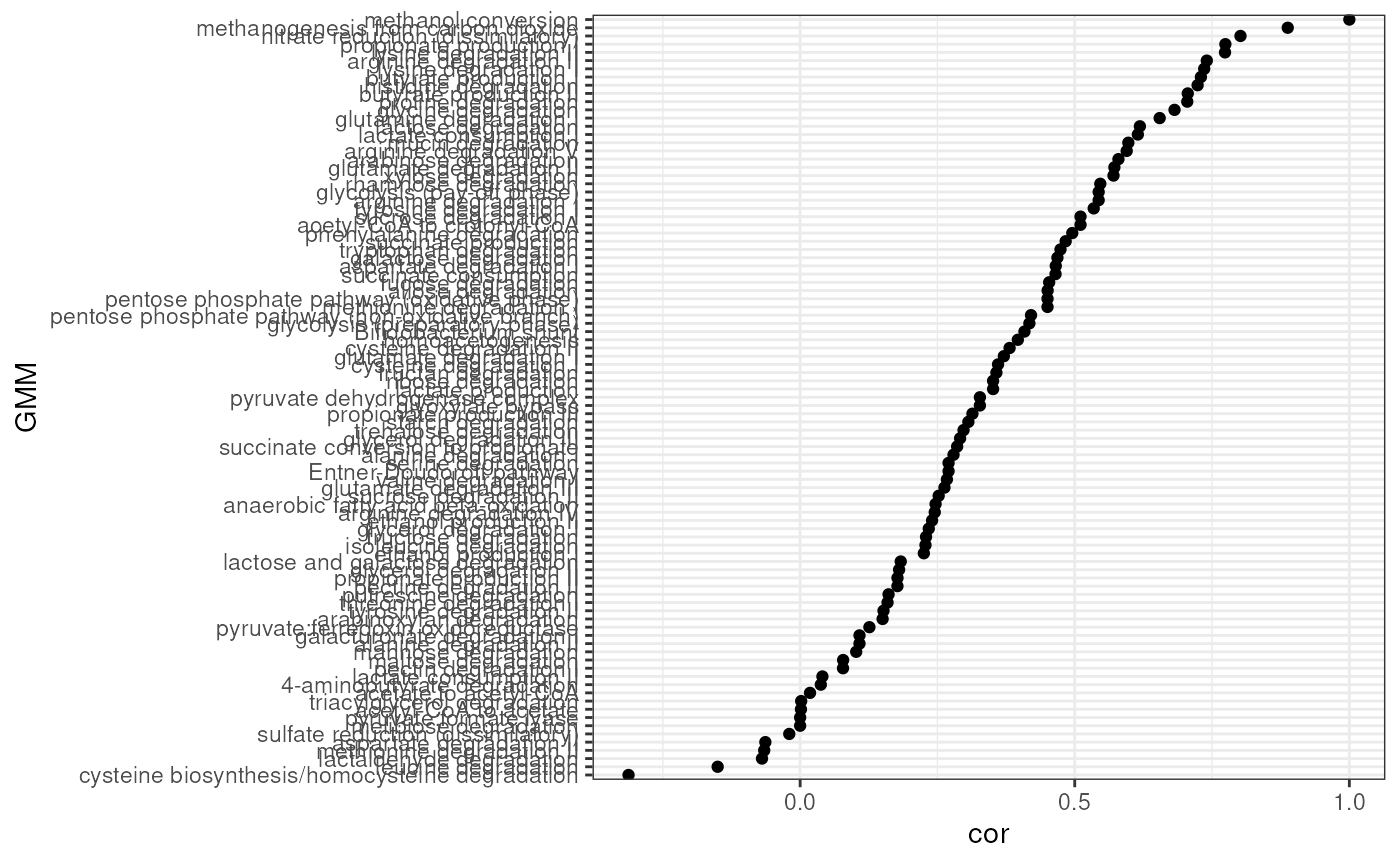
Reproducibility
R session information:
#> R version 4.6.0 (2026-04-24)
#> Platform: x86_64-pc-linux-gnu
#> Running under: Ubuntu 24.04.4 LTS
#>
#> Matrix products: default
#> BLAS:   /usr/lib/x86_64-linux-gnu/openblas-pthread/libblas.so.3
#> LAPACK: /usr/lib/x86_64-linux-gnu/openblas-pthread/libopenblasp-r0.3.26.so;  LAPACK version 3.12.0
#>
#> locale:
#>  [1] LC_CTYPE=en_US.UTF-8       LC_NUMERIC=C               LC_TIME=en_US.UTF-8        LC_COLLATE=en_US.UTF-8
#>  [5] LC_MONETARY=en_US.UTF-8    LC_MESSAGES=en_US.UTF-8    LC_PAPER=en_US.UTF-8       LC_NAME=C
#>  [9] LC_ADDRESS=C               LC_TELEPHONE=C             LC_MEASUREMENT=en_US.UTF-8 LC_IDENTIFICATION=C
#>
#> time zone: UTC
#> tzcode source: system (glibc)
#>
#> attached base packages:
#> [1] stats4    stats     graphics  grDevices utils     datasets  methods   base
#>
#> other attached packages:
#>  [1] miaViz_1.21.0                   ggraph_2.2.2                    ggplot2_4.0.3
#>  [4] mia_1.19.8                      MultiAssayExperiment_1.39.0     curatedMetagenomicData_3.19.0
#>  [7] TreeSummarizedExperiment_2.21.0 Biostrings_2.81.1               XVector_0.53.0
#> [10] SingleCellExperiment_1.35.0     SummarizedExperiment_1.43.0     Biobase_2.73.1
#> [13] GenomicRanges_1.65.0            Seqinfo_1.3.0                   IRanges_2.47.0
#> [16] S4Vectors_0.51.1                BiocGenerics_0.59.0             generics_0.1.4
#> [19] MatrixGenerics_1.25.0           matrixStats_1.5.0               ariadne_0.2.3
#> [22] BiocStyle_2.41.0
#>
#> loaded via a namespace (and not attached):
#>   [1] splines_4.6.0               MultiFactor_0.1.2           ggplotify_0.1.3             filelock_1.0.3
#>   [5] tibble_3.3.1                polyclip_1.10-7             XML_3.99-0.23               DirichletMultinomial_1.55.0
#>   [9] lifecycle_1.0.5             httr2_1.2.2                 vroom_1.7.1                 lattice_0.22-9
#>  [13] MASS_7.3-65                 SnowballC_0.7.1             magrittr_2.0.5              sass_0.4.10
#>  [17] rmarkdown_2.31              jquerylib_0.1.4             yaml_2.3.12                 otel_0.2.0
#>  [21] DBI_1.3.0                   RColorBrewer_1.1-3          abind_1.4-8                 purrr_1.2.2
#>  [25] yulab.utils_0.2.4           tweenr_2.0.3                rappdirs_0.3.4              gdtools_0.5.0
#>  [29] ggrepel_0.9.8               tokenizers_0.3.0            irlba_2.3.7                 tidytree_0.4.7
#>  [33] rentrez_1.2.4               vegan_2.7-3                 pkgdown_2.2.0               permute_0.9-10
#>  [37] DelayedMatrixStats_1.35.0   codetools_0.2-20            DelayedArray_0.39.1         scuttle_1.23.0
#>  [41] ggforce_0.5.0               tidyselect_1.2.1            aplot_0.2.9                 farver_2.1.2
#>  [45] ScaledMatrix_1.21.0         viridis_0.6.5               BiocFileCache_3.3.0         jsonlite_2.0.0
#>  [49] BiocNeighbors_2.7.2         decontam_1.33.0             tidygraph_1.3.1             scater_1.41.1
#>  [53] systemfonts_1.3.2           tools_4.6.0                 ggnewscale_0.5.2            progress_1.2.3
#>  [57] treeio_1.37.0               ragg_1.5.2                  Rcpp_1.1.1-1.1              glue_1.8.1
#>  [61] gridExtra_2.3               SparseArray_1.13.2          xfun_0.57                   mgcv_1.9-4
#>  [65] dplyr_1.2.1                 withr_3.0.2                 BiocManager_1.30.27         fastmap_1.2.0
#>  [69] bluster_1.23.0              digest_0.6.39               rsvd_1.0.5                  R6_2.6.1
#>  [73] gridGraphics_0.5-1          textshaping_1.0.5           RSQLite_3.52.0              ecodive_2.2.6
#>  [77] tidyr_1.3.2                 fontLiberation_0.1.0        data.table_1.18.4           DECIPHER_3.9.0
#>  [81] prettyunits_1.2.0           graphlayouts_1.2.3          httr_1.4.8                  htmlwidgets_1.6.4
#>  [85] S4Arrays_1.13.0             pkgconfig_2.0.3             gtable_0.3.6                blob_1.3.0
#>  [89] S7_0.2.2                    janeaustenr_1.0.0           htmltools_0.5.9             fontBitstreamVera_0.1.1
#>  [93] bookdown_0.46               scales_1.4.0                png_0.1-9                   ggfun_0.2.0
#>  [97] knitr_1.51                  tzdb_0.5.0                  reshape2_1.4.5              rncl_0.8.9
#> [101] nlme_3.1-169                curl_7.1.0                  cachem_1.1.0                stringr_1.6.0
#> [105] BiocVersion_3.24.0          parallel_4.6.0              vipor_0.4.7                 arrow_24.0.0
#> [109] AnnotationDbi_1.75.0        desc_1.4.3                  pillar_1.11.1               grid_4.6.0
#> [113] vctrs_0.7.3                 BiocSingular_1.29.0         dbplyr_2.5.2                beachmat_2.29.0
#> [117] cluster_2.1.8.2             beeswarm_0.4.0              evaluate_1.0.5              readr_2.2.0
#> [121] cli_3.6.6                   compiler_4.6.0              rlang_1.2.0                 crayon_1.5.3
#> [125] tidytext_0.4.3              labeling_0.4.3              forcats_1.0.1               plyr_1.8.9
#> [129] fs_2.1.0                    ggbeeswarm_0.7.3            ggiraph_0.9.6               stringi_1.8.7
#> [133] viridisLite_0.4.3           BiocParallel_1.47.0         assertthat_0.2.1            lazyeval_0.2.3
#> [137] fontquiver_0.2.1            Matrix_1.7-5                ExperimentHub_3.3.0         patchwork_1.3.2
#> [141] hms_1.1.4                   sparseMatrixStats_1.25.0    bit64_4.8.0                 KEGGREST_1.53.0
#> [145] AnnotationHub_4.1.0         igraph_2.3.1                memoise_2.0.1               bslib_0.10.0
#> [149] rotl_3.1.1                  ggtree_4.3.0                bit_4.6.0                   ape_5.8-1